
Understanding better what happens before the sale
In retail, sales show the end result, but they don’t always explain everything that happens beforehand.
A store may sell more because it receives more footfall, because it converts better, because its window display attracts more attention, or because certain customer profiles respond better to a specific campaign. Without proper measurement, separating these factors is complex.
MultiÓpticas wanted to add a layer of analysis that would let it start answering key questions about in-store behavior:
- How many people pass by each store?
- What share of that outside footfall actually enters the store?
- How does footfall evolve by day, hour or location?
- What differences exist between stores with similar characteristics?
- How do footfall, conversion and sales relate to each other?
- What audience profile visits each store?
- How to integrate this information into its own analytics systems?
The need was not just to measure footfall, but to start building a more complete view of the store’s physical performance.
A first layer of intelligence over the point of sale
Flame Analytics proposed a solution designed to help MultiÓpticas analyze the behavior of its stores from a more complete perspective.
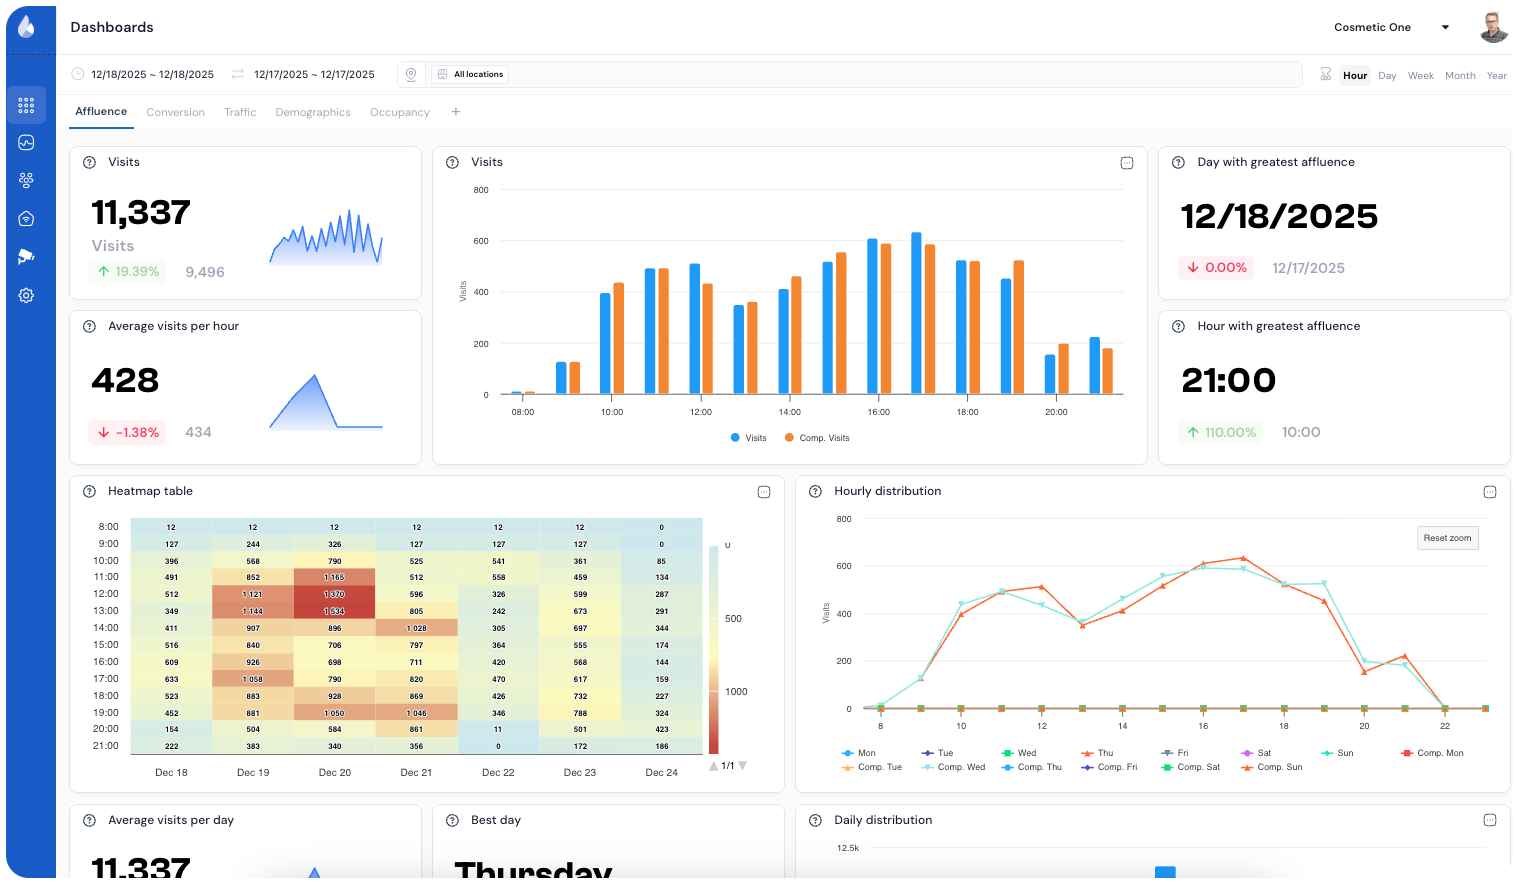
The platform makes it possible to measure outside footfall, analyze store entries, calculate conversion and cross footfall with sales results. This way, the company can start to better interpret the performance of each store and spot improvement opportunities with objective data.
In addition, demographic analytics make it possible to segment the audience by age and gender, always anonymously and without storing images. This information adds context to understand the visitor profile of each store and to better analyze campaigns, locations and behaviors.
One of the key aspects of the project is the ability to integrate the data generated by Flame into MultiÓpticas’ corporate dashboards, making store information part of the company’s reporting ecosystem.
A project designed to grow progressively
Although MultiÓpticas runs a large network, the project has been approached gradually. This approach makes it possible to validate the solution in the first stores, fine-tune the configuration, ensure data quality and gather learnings before moving on to new phases.
This model is especially relevant in retail projects with multiple locations, where scalability depends not only on technology, but also on operational coordination, installation, calibration and data monitoring.
The result is an orderly rollout model, designed to support the growth of the project store by store.
First stores live and a network-wide view
The project is currently in an initial phase, with the first stores already live on the Flame Analytics platform.
From these locations, MultiÓpticas can analyze daily footfall, traffic patterns by hour and day, peak activity moments, conversion and the evolution of each store.
This information helps support decisions related to staff planning, opening hours, campaign analysis, store-to-store comparison and the identification of improvement opportunities.
Beyond the individual data of each store, this first phase builds a useful knowledge base for future phases of the project.
From one-off measurement to a network-wide view
The project with MultiÓpticas represents a first step toward a more connected and analytical management of the physical point of sale.
Based on the data gathered in the first stores, the company can start to look at the performance of its stores from a more complete perspective: outside opportunity, entries, visitor profile, conversion and sales.
In a large retail network, having reliable and comparable information from the early phases makes it possible to build a stronger model to make decisions, detect patterns and scale learnings.
MultiÓpticas is starting to turn physical store data into a tool for analysis and continuous improvement, relying on Flame Analytics to move toward a smarter view of its network.