Discover the full conversion journey
See how visitors evolve from passers-by to buyers and where the funnel leaks.

See your physical conversion funnel end-to-end — from street traffic to in-store engagement and final purchase. Understand what attracts, what holds attention and what triggers the sale.
Turn intuition into action plan: where to optimize, when to intervene, and what truly moves the needle.
See how visitors evolve from passers-by to buyers and where the funnel leaks.
Find which storefronts, campaigns and hours attract more and keep them longer.
Correlate time spent with sales to fine-tune layout, staffing and promotions.
Connect traffic and behavior with POS to surface what truly drives ROI.
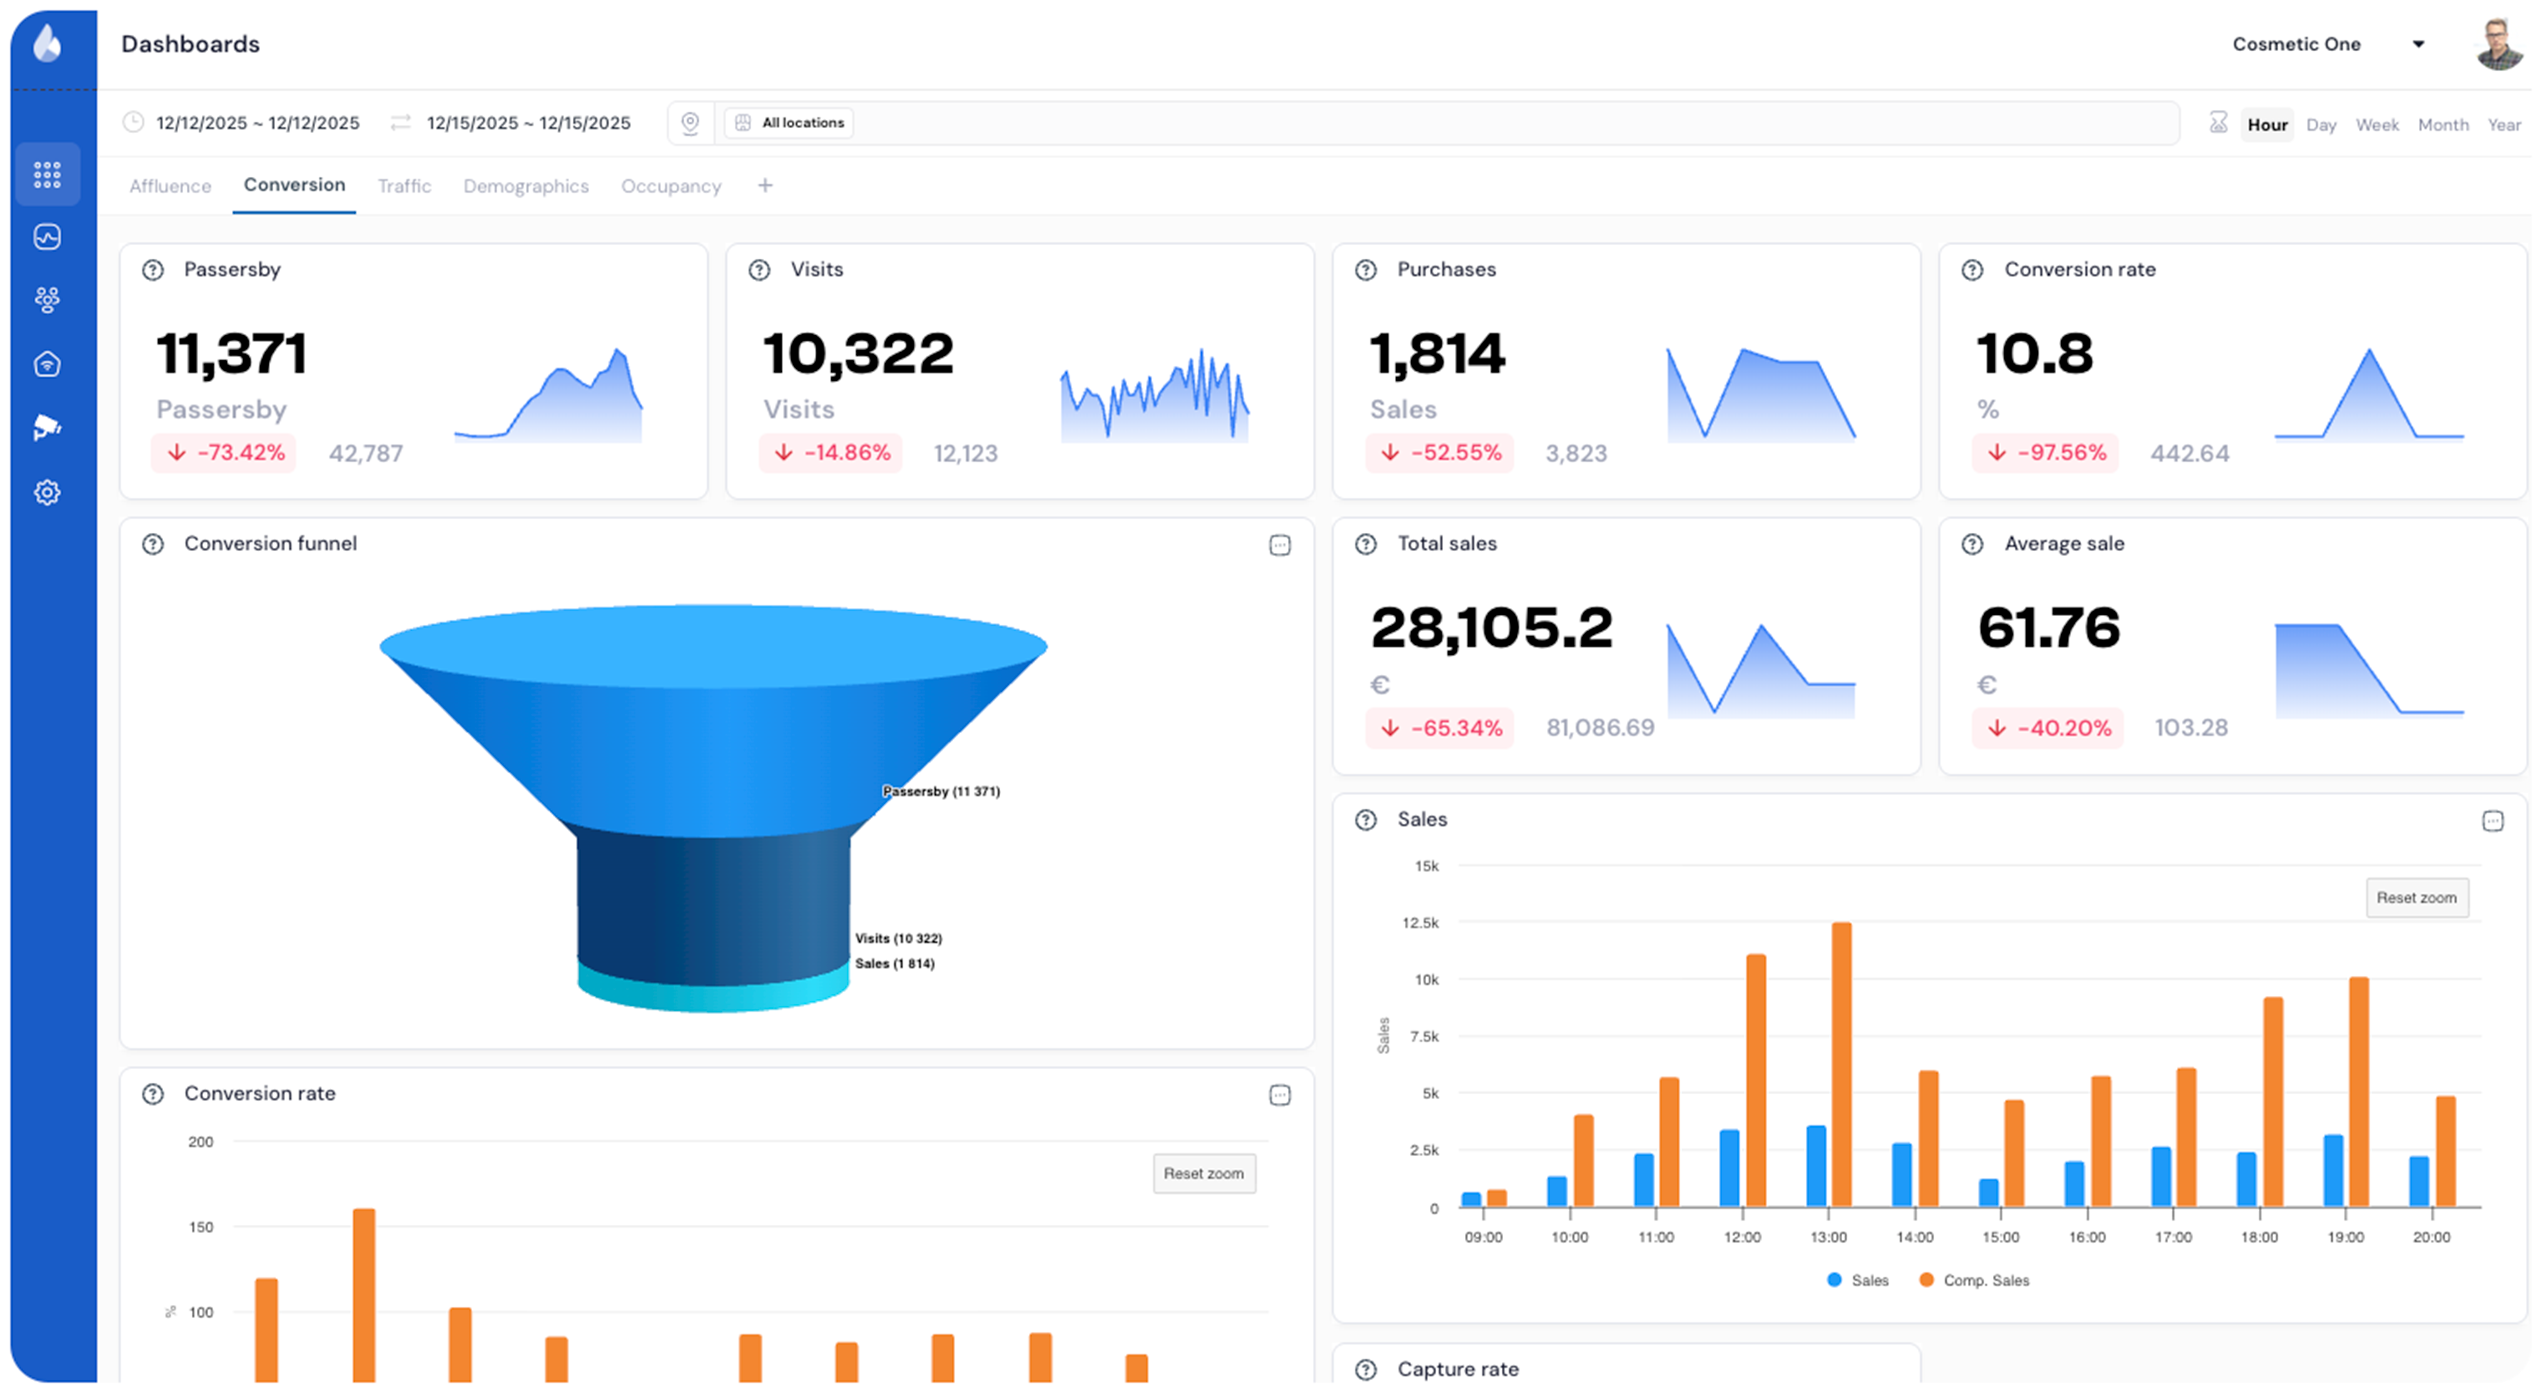
Flame Conversion connects visitor analytics with sales data to visualize the full funnel — from street traffic to in-store engagement and purchases.
Analyze capture and conversion rates, dwell time and performance by zone, store or category. Turn data into action with real-time dashboards.
Cross visitors with operations and sales to discover actionable patterns.
Visitors vs. tickets generated. The metric that matters.
When you convert better and when opportunities are lost.
Which store areas sell and which only attract traffic.
Real economic value generated by each visitor.
Identify top-performers and replicate their practices.
Real conversion lift during and after each promotion.
Know your real conversion rate, not what you think it is.
Personalized demo in 20 minutes.
Flame Analytics is an advanced smart analytics platform designed to support a wide range of industries and sectors.
Decathlon wanted to know and better understand the behavior of its customers: how they interact at its points of sale and how they behave. With this, Decathlon sought to anticipate the demands of the clients in order to offer them a better
Alain Afflelou relies on Flame Analytics’ people counting solution to accurately measure footfall and optimize decision-making across its stores in Spain.
In the competitive world of shopping centers, customer loyalty and experience have become crucial factors for long-term success. CBRE Spain, a leader in real estate management, recently implemented Connect Mall Edition, our innovative loyal
Discover the power of Flame in just 20 minutes and learn how it can improve the results of your organization.
Schedule a personalized demo with our experts